black and brown leather padded tub sofa

Inteligência de Dados para PMEs e Provedores de Internet

Dashboards em Power BI, automação de análises e modelos preditivos para reduzir churn, aumentar eficiência e apoiar decisões estratégicas.

Inteligência de dados para decisões estratégicas

Na AM Consultoria, desenvolvemos soluções em Business Inteligence, automação de dados e visualização estratégica, utilizando Power BI e Python para transformar dados operacionais em insights acionáveis.
Ajudamos pequenas e médias empresas e provedores de internet a enxergar seus números com clareza, rapidez e confiabilidade.

Inovação e tecnologia contínua
Foco em performance e resultados

Nosso foco é performance mensurável. Atuamos com indicadores claros, automações inteligentes e análises orientadas a negócio para apoiar decisões que reduzem custos, aumentam eficiência operacional e melhoram resultados.
Transformamos dados brutos em ações práticas, não apenas em relatórios.

Soluções Inteligentes em Dados

BI, automação e inteligência analítica aplicados a problemas reais de negócio.

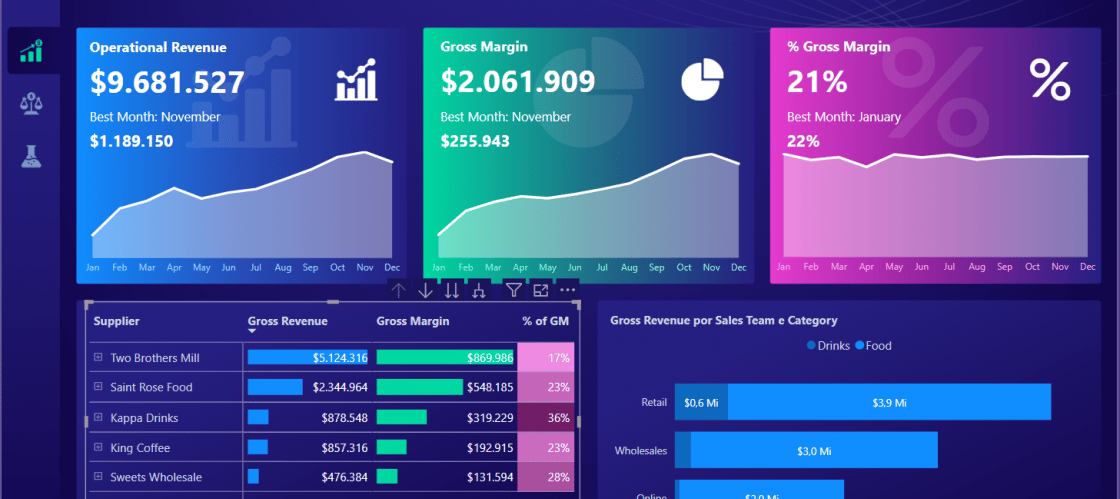
Business Intelligence e Análise de Dados

Desenvolvemos dashboards analíticos e estratégicos em Power BI, conectando dados de Excel, CRM, sistemas internos e Grafana para apoiar decisões baseadas em indicadores confiáveis.

A computer screen displaying analytics dashboards with various charts, including a line graph on the left and a cohort analysis table on the right. The table is populated with different shades of blue, indicating varying levels of user activity over several weeks. Text labels and numbers detail user retention statistics.
Automação de Processos e Dados

Automatizamos rotinas operacionais e fluxos de dados com Python e integrações inteligentes, reduzindo tarefas manuais, erros operacionais e tempo de análise.
Ideal para PMEs e ISPs que precisam de eficiência e escala.

An iPad displaying data visualization content next to a book titled 'Data Science for Business.' The iPad is showing notes and a diagram about dashboard design, accompanied by a stylus placed between the iPad and the book.
Inteligência de Dados para ISPs
Análise Preditiva e Churn (em desenvolvimento)

Desenvolvemos análises específicas para provedores de internet, incluindo massivas, rompimentos, MTTR, recorrência de chamados e indicadores de qualidade de rede, apoiando decisões técnicas e estratégicas com base em dados confiáveis.

Estudos e modelos analíticos em Machine Learning para identificar padrões de comportamento, recorrência de problemas e risco de churn em negócios com receita recorrente, apoiando ações preventivas e estratégicas.

Projetos e Soluções em Dados

Exemplos de projetos em Business Inteligence, automação e análise de dados aplicados a desafios reais de negócio.

An abstract, pastel-colored, 3D-rendered representation of data analysis and search engine optimization (SEO). The image features a computer interface with various analytics symbols, including a magnifying glass, bar charts, pie charts, and a search bar with the text 'SEO'. Surrounding the interface are different objects such as a potted plant, a cup with a saucer, and a megaphone, all placed on a light green background.
Business Inteligence e Dashboards

Desenvolvimento de dashboards analíticos e estratégicos em Power BI, com processos de ETL estruturados para garantir dados confiáveis, atualizados e prontos para decisão.

A person is viewing a map with red data points on a computer monitor, likely indicating a geographical distribution. The image has a focus on technology and data analysis.
A laptop with an open screen displaying dashboard analytics featuring charts, graphs, and numerical data related to sales and subscriptions. The interface is predominantly dark-themed with sections highlighting key performance metrics. The device shown is a MacBook Pro, indicated by the keyboard layout and branding.
A laptop displaying a dashboard with various graphs, charts, and numeric data. The screen is partially visible, showcasing sections with line graphs, financial figures, and small images. The background is blurred with a prominent red light creating a warm ambiance.
Automação de Processos e Dados

Automação de rotinas operacionais e pipelines de dados com Python, reduzindo retrabalho, erros manuais e tempo de geração de relatórios.

A AM Consultoria transformou nossos dados em insights valiosos. Os dashboards interativos e a automação otimizada elevaram nossa tomada de decisão a um novo patamar.

Ronaldo Soares

A digital chart display featuring a green line graph against a dark background, with data units labeled in white text. The line graph suggests an analysis of data volume, with sharp peaks and valleys. The lower portion of the graph is highlighted in red, indicating critical data points or alerts.

★★★★★